
Pet Food Summary Reports
Annual Feed Summary Reports
- 2023 Feed Summary Report
- 2022 Feed Summary Report
- 2021 Feed Summary Report
- 2020 Feed Summary Report
- 2019 Feed Summary Report
- 2018 Feed Summary Report
- 2017 Feed Summary Report
- 2016 Feed Summary Report
Annual Seed Summary Reports
- 2023 Seed Summary Report
- 2022 Seed Summary Report
- 2021 Seed Summary Report
- 2020 Seed Summary Report
- 2019 Seed Summary Report
- 2018 Seed Summary Report
- 2017 Seed Summary Report
- 2016 Seed Summary Report
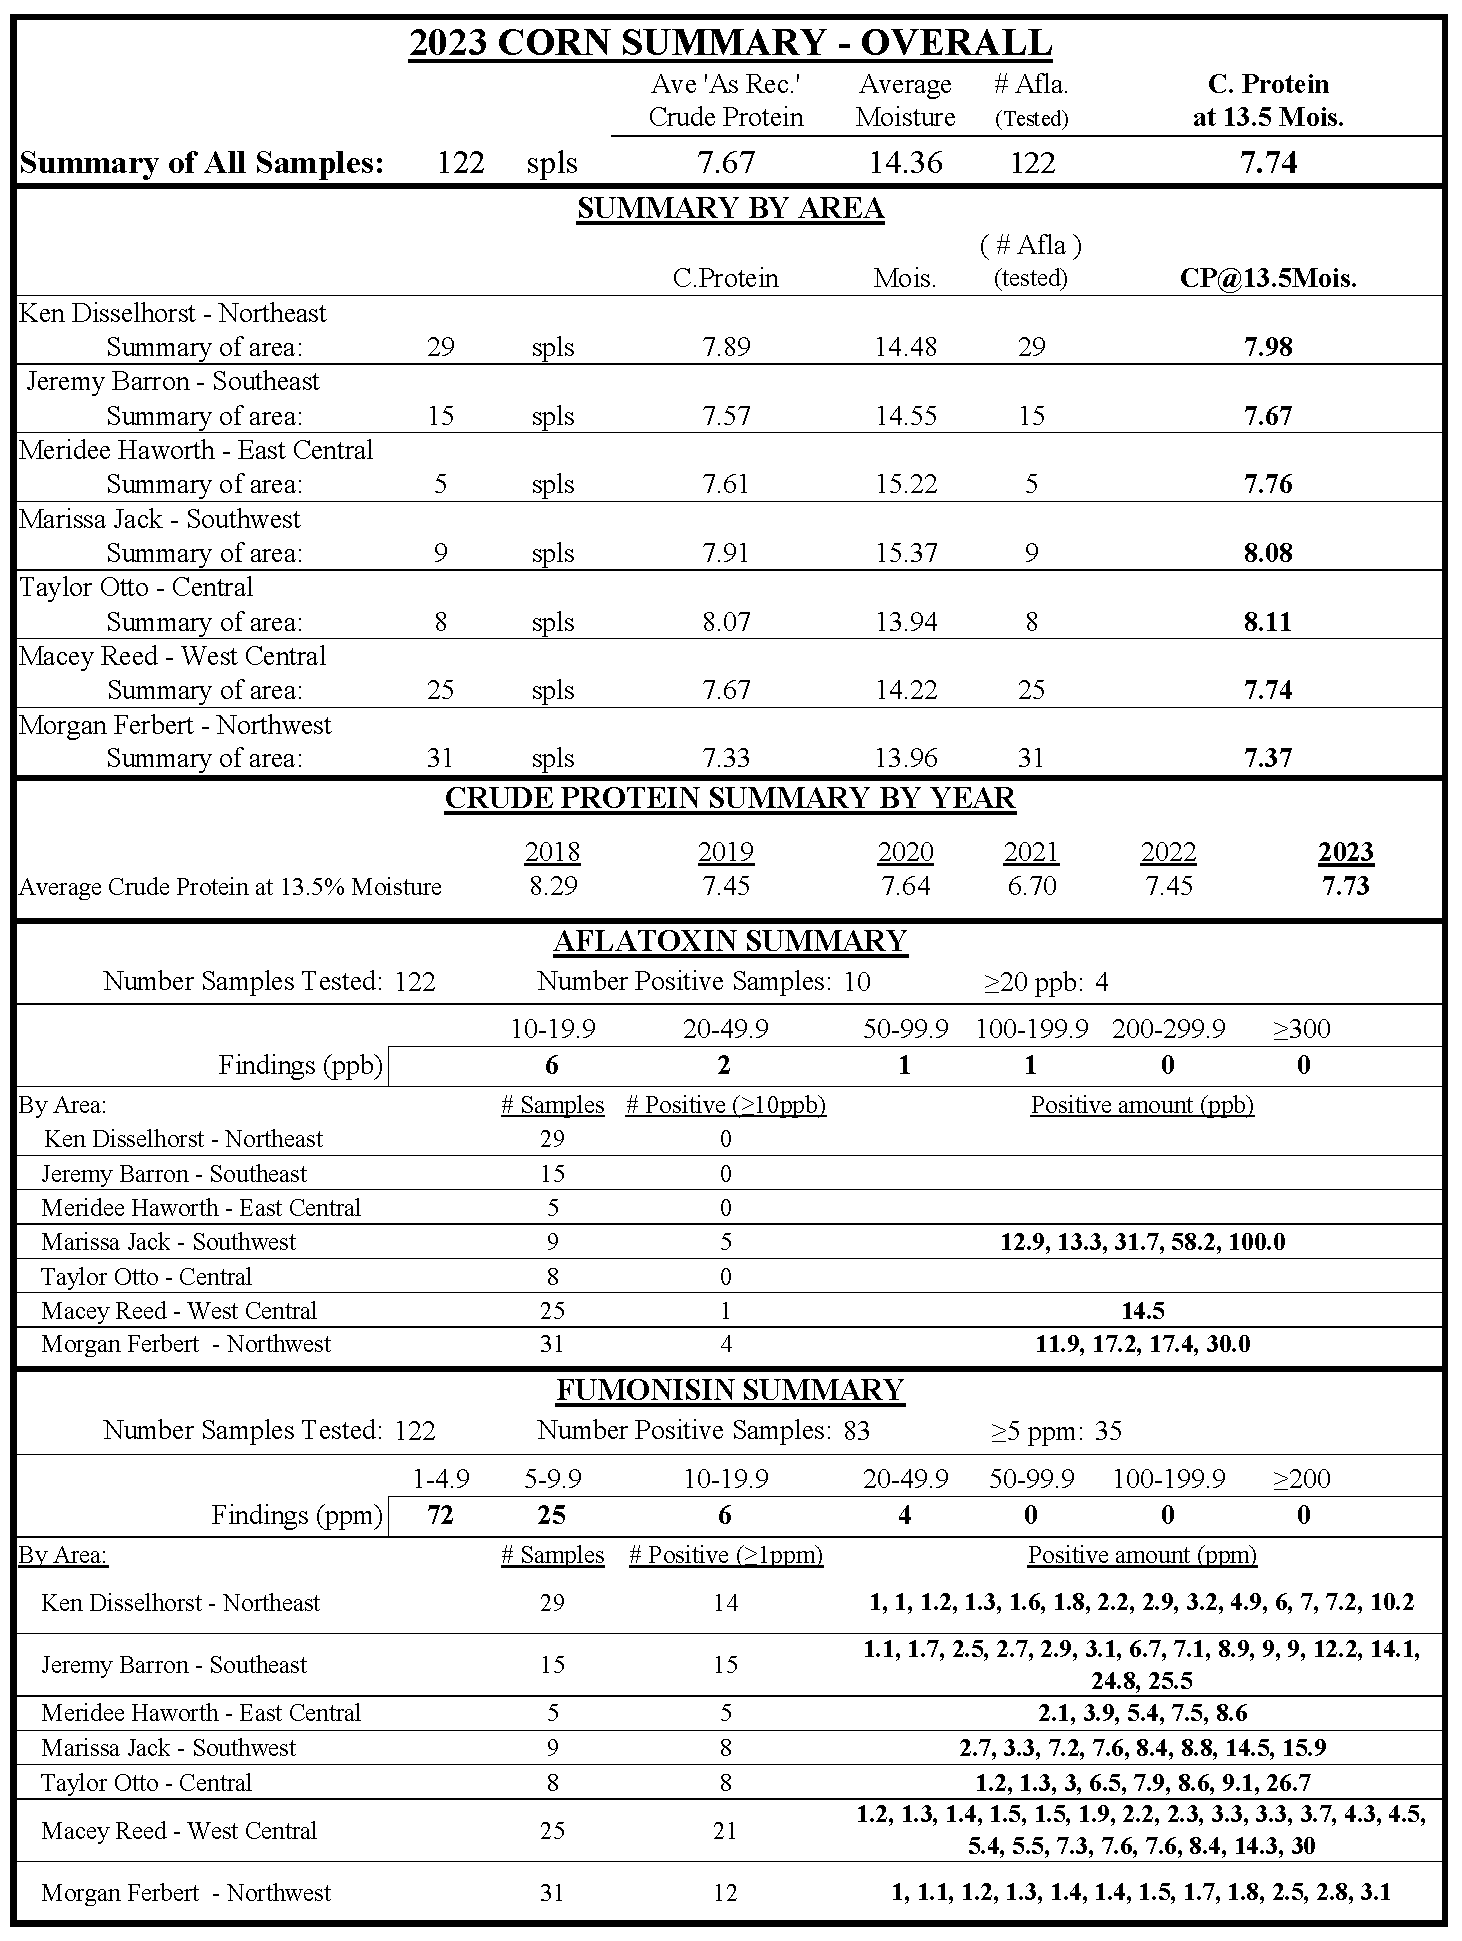
Corn Survey
The Missouri Department of Agriculture (MDA) Plant Industries Division, Feed Regulatory Program conducts the Corn Survey each year during harvest season. Samples of corn are drawn from counties having an expected production of greater than 1.5 million bushels in a harvest season, with one sample added for each additional two million bushels produced. This survey has been reported annually since 1993. The survey reports indicate findings of mycotoxins, like aflatoxin, commonly found in corn. If corn is found containing toxin levels exceeding FDA guidelines for safe use for animals, the facility at which the corn was sampled is notified immediately.
For in depth information about the Corn Survey, please see the Annual Feed Summary above.
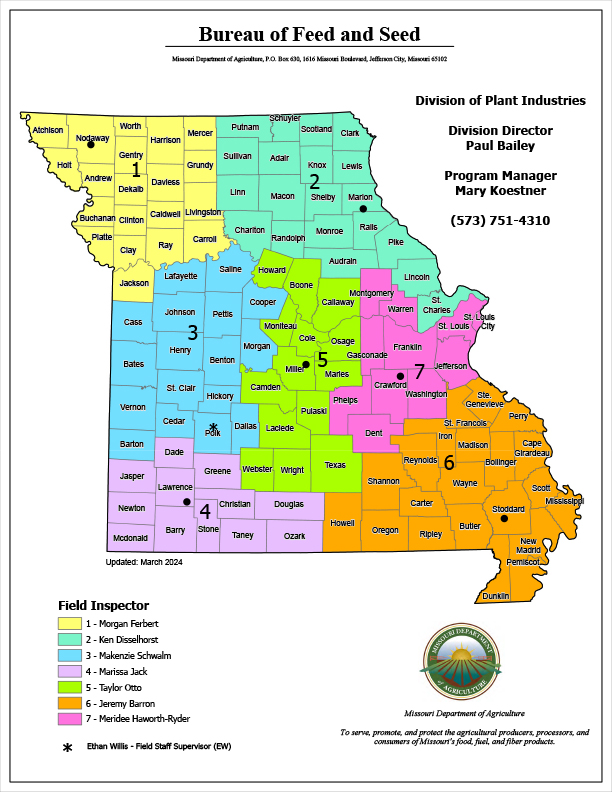
Determine your area here
Bureau of Feed and Seed Inspector Territory Map
Quick Links
Contact Information
Bureau of Feed and Seed
Phone: (573) 751-4310
Fax: (573) 751-5500
E-Mail: FSTT@mda.mo.gov
Bureau staff
Frequently Asked Questions
Answers to the most commonly asked questions we receive and submit your questions if not answered to FSTT@mda.mo.gov.
FAQs